Are you struggling to keep your business operations running smoothly? You’re not alone. According to a 2023 survey, 60% of companies cite performance monitoring as critical for growth.
Yet, many still rely on outdated tools, missing out on crucial insights. In today’s fast-paced world, where every second counts, the right tools can make or break your business.
This guide will take you through the top tools that can transform how you monitor and enhance your business performance, ensuring you stay ahead of the competition. Ready to elevate your business? Let’s dive in.
Datadog.Com: A Top Tool for Business Performance Monitoring
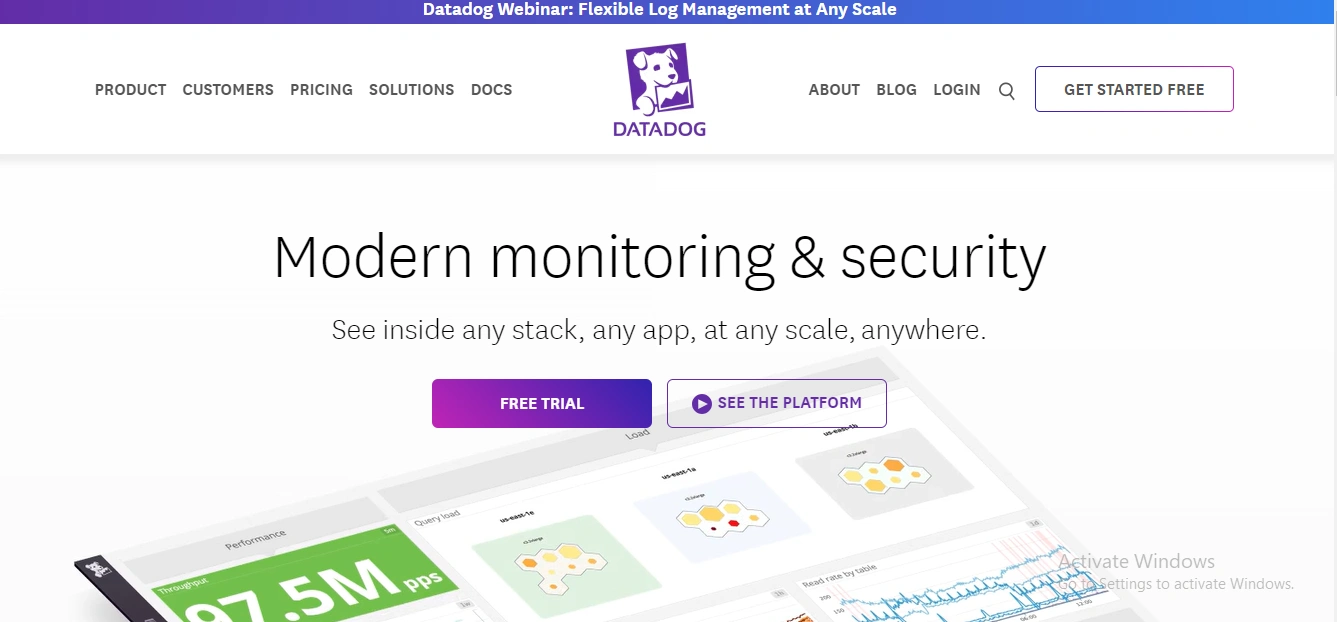
Datadog is a powerful, versatile tool that excels in providing comprehensive monitoring and performance management across cloud environments, making it a top choice for businesses that require real-time visibility into their IT operations.
While it offers unparalleled features like APM, machine learning alerts, and extensive integrations, potential users should be prepared for a learning curve and carefully consider the pricing structure to ensure it fits within their budget.
For businesses looking to unify their monitoring efforts and gain deep insights into their infrastructure and applications, Datadog stands out as a leading solution in the market.
Reason to Buy:
- Unified Monitoring Platform: Datadog offers an all-in-one solution for monitoring infrastructure, applications, logs, and user experience, providing businesses with a complete overview of their IT environment.
- Real-Time Insights: With its real-time data processing, Datadog enables companies to detect and resolve issues instantly, minimizing downtime and improving service reliability.
- Scalability: Datadog’s cloud-based architecture scales effortlessly, making it suitable for businesses of all sizes, from startups to large enterprises.
- Extensive Integrations: Over 450 integrations with third-party tools and services allow for seamless data collection and analysis across different platforms and environments.
- Customizable Dashboards: Users can tailor dashboards to meet specific monitoring needs, making it easy to track key performance indicators and visualize critical data.
What Sets Datadog Apart:
- Comprehensive APM: Datadog’s Application Performance Management (APM) feature is highly regarded for its ability to trace requests across distributed systems, optimize performance, and provide deep insights into application behavior.
- Machine Learning-Powered Alerts: Datadog uses machine learning algorithms to automatically detect anomalies, reducing false positives and ensuring that critical issues are flagged promptly.
- Synthetics Monitoring: This feature simulates user interactions with applications, allowing businesses to proactively identify and fix potential performance bottlenecks before they affect end users.
- Unified Data Across Teams: Datadog facilitates collaboration by providing a unified view of data that can be accessed and analyzed by development, operations, and business teams simultaneously, enhancing cross-functional communication.
- Strong Security Monitoring: Datadog’s security monitoring features include threat detection, real-time logs, and cloud security posture management, making it a versatile tool for both performance and security monitoring.
What It Lacks:
- Steep Learning Curve: The vast array of features and technical complexity of Datadog can be overwhelming for new users, especially those without a deep technical background.
- Pricing Complexity: Datadog’s pricing model, based on the number of hosts, logs, and events, can quickly become expensive, particularly for larger organizations or those with extensive monitoring needs.
- Interface Clutter: Some users report that the interface can feel cluttered and overwhelming due to the high volume of data and available features, which can make navigation and setup challenging for beginners.
Dynatrace.Com: A Top Tool for Business Performance Monitoring
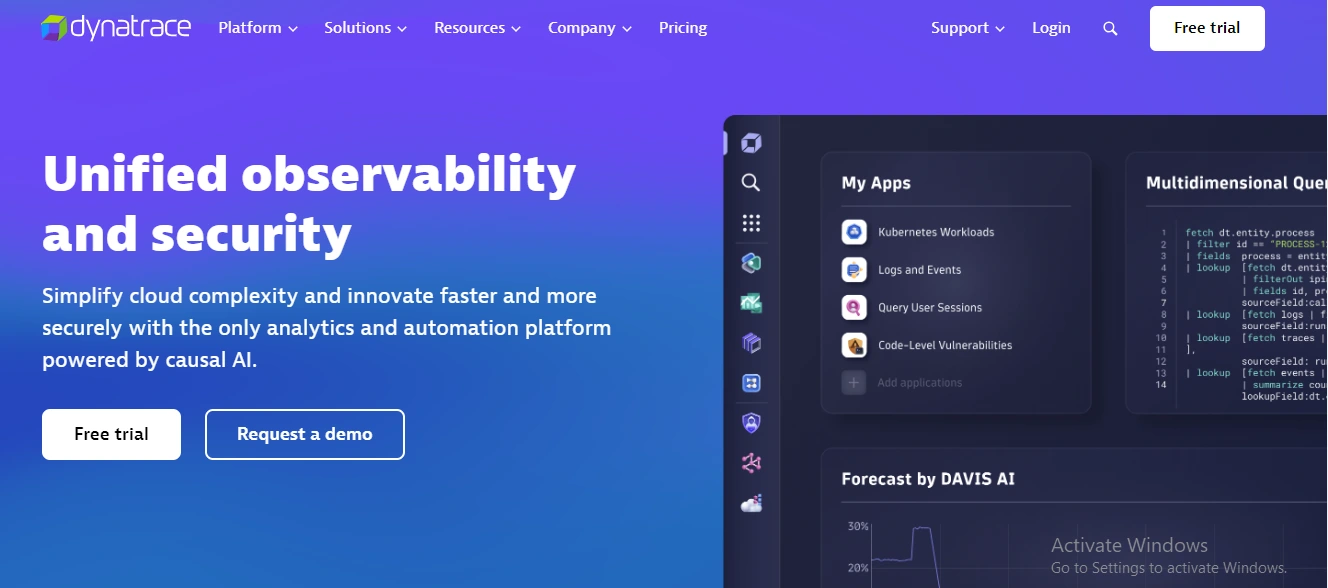
Dynatrace is a powerful tool tailored for large enterprises and complex IT environments that require comprehensive, real-time monitoring across multiple layers of their digital ecosystem.
Its AI-driven capabilities, particularly in root cause analysis and AIOps, set it apart from competitors, making it a leader in the observability space. However, its steep learning curve and high cost may make it less suitable for smaller organizations or those with simpler IT setups.
For businesses that need deep insights and proactive management of their IT infrastructure, Dynatrace is an excellent choice, though potential users should be prepared for a significant investment in both time and resources.
Reasons to Buy:
- AI-Powered Monitoring: Dynatrace excels in AI-driven root cause analysis, automatically detecting and diagnosing issues to reduce resolution times and improve system reliability.
- Comprehensive Visibility: The platform provides full-stack observability, covering everything from infrastructure and applications to user experience, making it a one-stop solution for monitoring complex IT environments.
- Digital Experience Monitoring: Dynatrace offers in-depth digital experience monitoring, including real user monitoring (RUM) and session replay, providing valuable insights into user behavior and system performance.
- Scalability: Designed to handle large-scale, dynamic environments, Dynatrace is ideal for enterprises with extensive and complex IT infrastructures.
- Integration Capabilities: With robust integration options, Dynatrace can seamlessly connect with a wide range of CI/CD tools, cloud services, and third-party applications, enhancing its utility across different platforms.
What Sets Dynatrace Apart:
- AI-Driven Root Cause Analysis: Unlike many other tools, Dynatrace leverages AI to automatically identify the root cause of issues, which significantly reduces manual effort and speeds up troubleshooting.
- Session Replay: This feature allows you to replay user sessions, providing a visual understanding of user interactions and helping bridge the gap between IT operations and business teams.
- AIOps Capabilities: Dynatrace is at the forefront of AIOps, using AI to automate IT operations, reduce noise, and ensure proactive incident management, making it a pioneer in this space.
- Real-Time Monitoring: The platform’s real-time monitoring capabilities ensure that you are always up-to-date with the current status of your IT environment, helping to maintain high availability and performance standards.
What It Lacks:
- Steep Learning Curve: Due to its extensive features and technical depth, Dynatrace can be overwhelming for new users, especially those without a strong technical background. It may require significant training to fully leverage its capabilities.
- High Cost: The pricing model of Dynatrace can be a deterrent for smaller organizations. The cost tends to rise significantly with the scale of deployment, particularly for businesses with a large number of hosts or complex environments.
- Interface Complexity: Although the interface is comprehensive, it can be cluttered and challenging to navigate, particularly for those new to the platform. This complexity can sometimes hinder quick access to critical data and features.
Nagios XI.Com: A Top Tool for Business Performance Monitoring
Nagios XI is a powerful and versatile monitoring tool that stands out for its cost-effectiveness, scalability, and extensive customization options.
While it may require a steeper learning curve and lacks some of the modern features found in newer tools, its robust functionality and strong community support make it an excellent choice for organizations looking to monitor their IT infrastructure comprehensively
However, those heavily reliant on cloud services or seeking a more modern user interface might find some limitations with Nagios XI.
Reasons to Buy:
- Cost-Effective Solution: Nagios XI offers a highly cost-effective monitoring solution, making it an attractive option for organizations with tight budgets or those seeking robust functionality without the high costs associated with other enterprise-level tools.
- Comprehensive Monitoring Capabilities: It provides extensive monitoring for servers, network devices, applications, databases, and more, ensuring that all critical aspects of IT infrastructure are covered.
- Highly Customizable: The tool is known for its flexibility and customization options, allowing users to tailor the monitoring experience to their specific needs, from custom dashboards to tailored alerts.
- Scalability: Nagios XI scales well, making it suitable for both small businesses and large enterprises. It can handle a wide range of monitoring requirements, from a few devices to thousands of nodes.
- Strong Community Support: With a large, active user base and extensive documentation, users benefit from a wealth of shared knowledge and resources, reducing the learning curve and facilitating troubleshooting.
What Sets Nagios XI Apart:
- Robust Plugin Ecosystem: Nagios XI’s extensive plugin support allows for enhanced monitoring capabilities. Users can leverage thousands of community-contributed plugins to extend the tool’s functionality, covering virtually any monitoring need.
- Efficient Resource Utilization: Nagios XI is designed to be lightweight and efficient, requiring minimal resources to operate effectively even when monitoring large infrastructures. This efficiency makes it particularly valuable for environments where resource utilization is a concern.
- Long-Term Data Retention: Nagios XI excels in long-term data retention, enabling organizations to store and analyze performance data over extended periods, which is crucial for trend analysis and capacity planning.
- Agentless Monitoring: The platform’s agentless monitoring model simplifies deployment and reduces the overhead associated with agent management, making it easier to maintain and scale.
What It Lacks:
- Outdated User Interface: While functional, the user interface of Nagios XI is considered dated compared to modern monitoring tools. It may require significant effort to make it more visually appealing and user-friendly.
- Limited Cloud Monitoring: Nagios XI’s cloud monitoring capabilities are somewhat limited compared to more modern tools. It lacks native support for comprehensive cloud service monitoring, particularly for multi-cloud environments, which can be a drawback for businesses heavily invested in cloud infrastructure.
- Complex Initial Setup: The initial setup and configuration can be complex and time-consuming, particularly for those new to the platform. While the tool becomes easier to manage with experience, the initial learning curve can be steep.
- Lack of Modern Reporting Tools: Users have noted that the reporting features in Nagios XI are not as advanced or flexible as those found in other tools. The absence of a modern report designer limits the ability to create customized reports easily.
Paessler PRTG.Com: A Top Tool for Business Performance Monitoring

PRTG Network Monitor is a robust and versatile tool that stands out for its comprehensive monitoring capabilities, ease of use, and flexible sensor-based licensing.
It’s particularly well-suited for small to medium-sized businesses and enterprises that require detailed monitoring without incurring significant additional costs.
While it has a few limitations, such as the need for careful sensor management and basic LDAP integration, its overall value, especially with its all-inclusive pricing and excellent support, makes it a top choice for IT teams looking to ensure the reliability and performance of their networks.
Reasons to Buy:
- Extensive Sensor Variety: PRTG Network Monitor offers over 250 types of sensors, allowing detailed monitoring across a wide range of devices, applications, and services. This makes it highly versatile for different business environments.
- All-Inclusive Pricing: The tool’s pricing model is straightforward, with all features included under the purchased license. This eliminates the need for additional costs or worrying about hidden fees for essential features like cloud monitoring or virtualization support.
- Ease of Use: PRTG is known for its user-friendly interface and easy setup process. The network discovery wizard simplifies initial configuration, making it accessible even for users with minimal technical experience.
- Excellent Support: Users consistently praise PRTG’s customer support for its responsiveness and effectiveness in resolving issues, which is crucial for maintaining reliable network monitoring.
- Customizable Monitoring: PRTG’s flexibility allows IT teams to tailor the monitoring system to their specific needs, from custom dashboards to tailored alerting mechanisms, enhancing its utility in diverse environments.
What Sets PRTG Network Monitor Apart:
- Sensor-Based Licensing: PRTG’s unique sensor-based licensing is highly flexible. Organizations can choose exactly how many sensors they need based on their monitoring requirements, allowing for efficient use of resources and better cost management.
- Comprehensive Mobile Support: PRTG excels in mobile accessibility. It offers robust mobile apps for Android and iOS, providing full access to monitoring data, alerts, and dashboards on the go, which is ideal for IT teams needing to manage networks remotely.
- Pre-Configured Libraries and Custom Dashboards: The software comes with pre-configured libraries for common metrics like CPU usage, memory, and network interfaces, as well as the ability to create custom dashboards tailored to specific monitoring needs.
- Broad Integration Support: PRTG integrates seamlessly with various IT environments and services, including VMware, Amazon CloudWatch, and Microsoft OneDrive, making it a versatile choice for businesses utilizing a mix of on-premises and cloud-based infrastructure.
What It Lacks:
- Sensor Capacity Management: While the sensor-based model is flexible, the sensors can be quickly consumed in large networks, necessitating careful management to avoid exhausting the available sensors too quickly.
- Basic Active Directory/LDAP Integration: PRTG’s Active Directory and LDAP integration is somewhat rudimentary and could benefit from enhancements to support more complex enterprise environments.
- Potential for Network Noise: The default sensor recommendations can introduce unnecessary network load if not managed properly. It requires a thoughtful approach to avoid performance issues on monitored devices.
Prometheus.Com: A Top Tool for Business Performance Monitoring
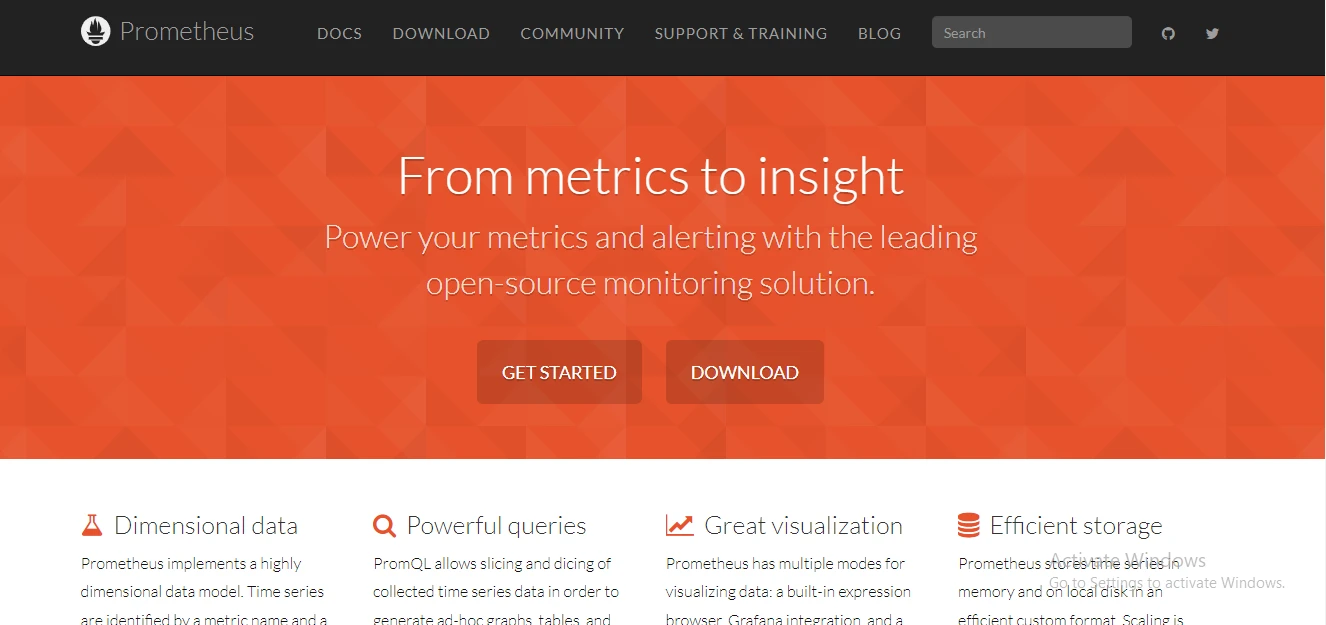
Prometheus is a powerful and flexible monitoring tool that is ideal for organizations looking for a scalable, open-source solution that can handle complex and dynamic environments.
Its strong integration with tools like Grafana and Kubernetes, along with its robust querying capabilities, make it a top choice for tech-savvy teams focused on cloud-native architectures. However, its steep learning curve and the need for extensive customization might be challenging for smaller teams or businesses with less technical expertise.
For those willing to invest the time and effort, Prometheus offers unparalleled monitoring capabilities that can be tailored to meet the specific needs of any organization.
Reasons to Buy:
- Open-Source Flexibility: Prometheus is a fully open-source monitoring and alerting toolkit, providing a cost-effective solution with extensive customization options for businesses of all sizes.
- Powerful Querying with PromQL: Prometheus includes PromQL, a highly flexible querying language designed specifically for monitoring time-series data, enabling in-depth analysis and precise monitoring.
- Integration with Popular Tools: Prometheus integrates seamlessly with popular visualization and orchestration tools like Grafana and Kubernetes, enhancing its usability in cloud-native and containerized environments.
- Scalable and Autonomous: Prometheus is designed for scalability, capable of handling the monitoring needs of large, dynamic infrastructures without reliance on distributed storage, making it a robust solution for growing businesses.
- Community Support: As a widely adopted open-source project, Prometheus benefits from a large, active community that continuously contributes to its development and offers extensive documentation and third-party plugins.
What Sets Prometheus Apart:
- Multi-Dimensional Data Model: Prometheus’s ability to handle multi-dimensional data with key-value pairs provides granular control over metrics, making it a standout choice for complex monitoring setups.
- Time-Series Data Handling: Its built-in time-series database is optimized for high-performance metrics handling, making it especially effective for environments requiring real-time monitoring and historical data analysis.
- Alertmanager Integration: Prometheus uses Alertmanager for handling alerts, offering advanced alerting capabilities like deduplication, grouping, and routing, which are crucial for maintaining system reliability in production environments.
What It Lacks:
- Steep Learning Curve: The flexibility and power of Prometheus come with a steep learning curve, particularly for users new to time-series databases or monitoring systems. This may require significant time investment to fully leverage its capabilities.
- Limited Out-of-the-Box Features: While Prometheus excels in customization, it lacks certain out-of-the-box features like automated remediation, comprehensive security monitoring, and long-term data storage, which might be available in more feature-rich commercial tools.
- Complex Setup for Non-Kubernetes Environments: Prometheus is particularly well-suited for Kubernetes and cloud-native environments. However, its configuration and integration can be more challenging in traditional IT environments or when monitoring systems outside of Kubernetes.
Sematext Monitoring.Com: A Top Tool for Business Performance Monitoring
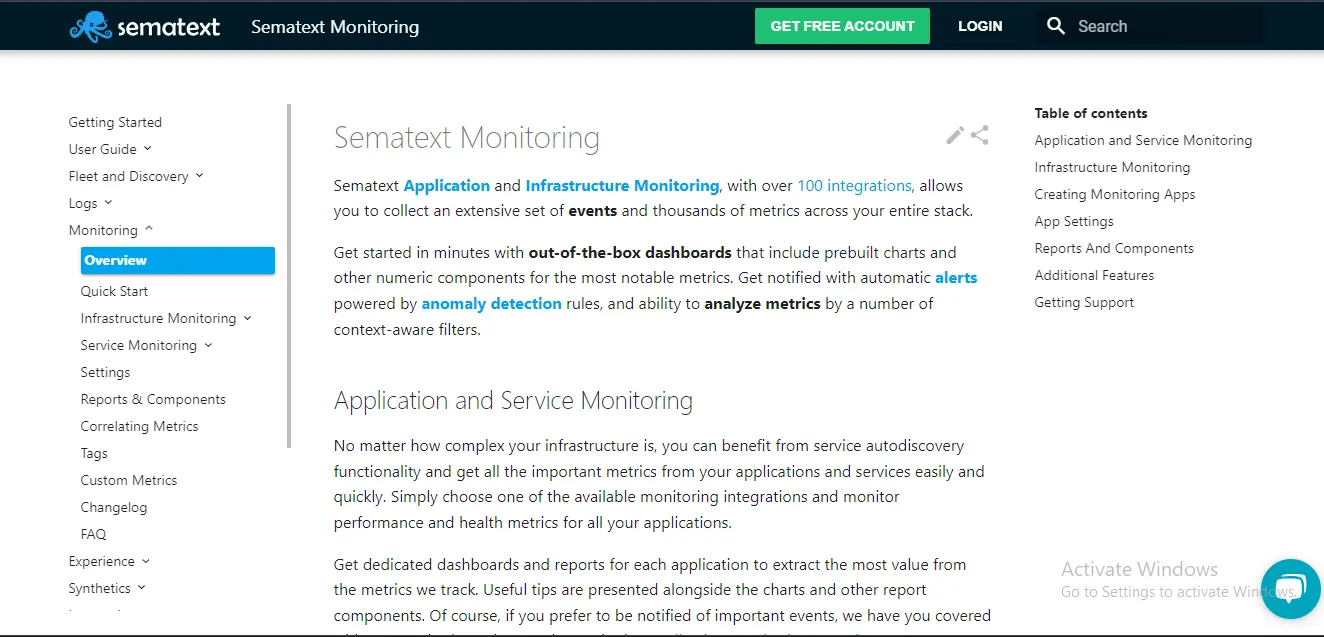
Sematext Monitoring is a versatile and powerful tool that provides comprehensive monitoring capabilities across various environments.
It is especially well-suited for organizations that require a unified view of their infrastructure and applications, along with robust integrations and real-time monitoring.
While it may present a learning curve and lacks some advanced features found in other tools, its cost-effectiveness and extensive functionality make it an excellent choice for businesses of all sizes looking to enhance their monitoring capabilities.
Reasons to Buy:
- All-in-One Monitoring Solution: Sematext offers a unified platform that includes infrastructure monitoring, log management, real user monitoring, synthetic monitoring, and application performance monitoring, providing comprehensive visibility across your entire technology stack.
- Real-Time Visibility: It delivers real-time insights into infrastructure and application performance, allowing for proactive issue resolution before they impact end users.
- Extensive Integrations: Sematext integrates with a wide range of technologies and platforms, including Kubernetes, Docker, MySQL, AWS, and more, making it versatile and adaptable to various environments.
- Pre-Built Dashboards and Alerts: The platform comes with out-of-the-box dashboards and alerting rules, enabling quick setup and faster troubleshooting without needing extensive configuration.
- Cost-Effective: Sematext provides a robust set of features at a competitive price point, making it an attractive option for businesses looking to balance cost and functionality.
What Sets Sematext Apart:
- Unified Monitoring Across Environments: Sematext’s ability to monitor on-premise, cloud, and hybrid environments from a single platform is a significant advantage, particularly for organizations managing diverse infrastructures.
- Customizable Dashboards: The platform offers highly customizable dashboards that allow users to tailor their monitoring views to specific needs, improving the relevance and utility of the data presented.
- Synthetic Monitoring Capabilities: Sematext’s synthetic monitoring feature allows businesses to simulate user interactions with websites and APIs, providing insights into performance and availability from a user perspective.
- Container and Kubernetes Monitoring: With specialized support for containerized environments, Sematext provides detailed metrics and logs for Docker and Kubernetes, helping organizations manage and optimize these increasingly popular technologies.
What It Lacks:
- Initial Learning Curve: While Sematext offers a comprehensive feature set, new users may find the platform’s initial setup and configuration challenging, particularly when integrating multiple services.
- Limited Advanced Features: Compared to some competitors, Sematext lacks certain advanced features like automated remediation and deep anomaly detection, which might be necessary for more complex or larger-scale operations.
- Potential Overhead in Large Deployments: As with many monitoring tools, the extensive data collection and analysis performed by Sematext can introduce overhead, especially in very large deployments. This requires careful management to avoid performance impacts on monitored systems.
Geckoboard.Com: A Top Tool for Business Performance Monitoring
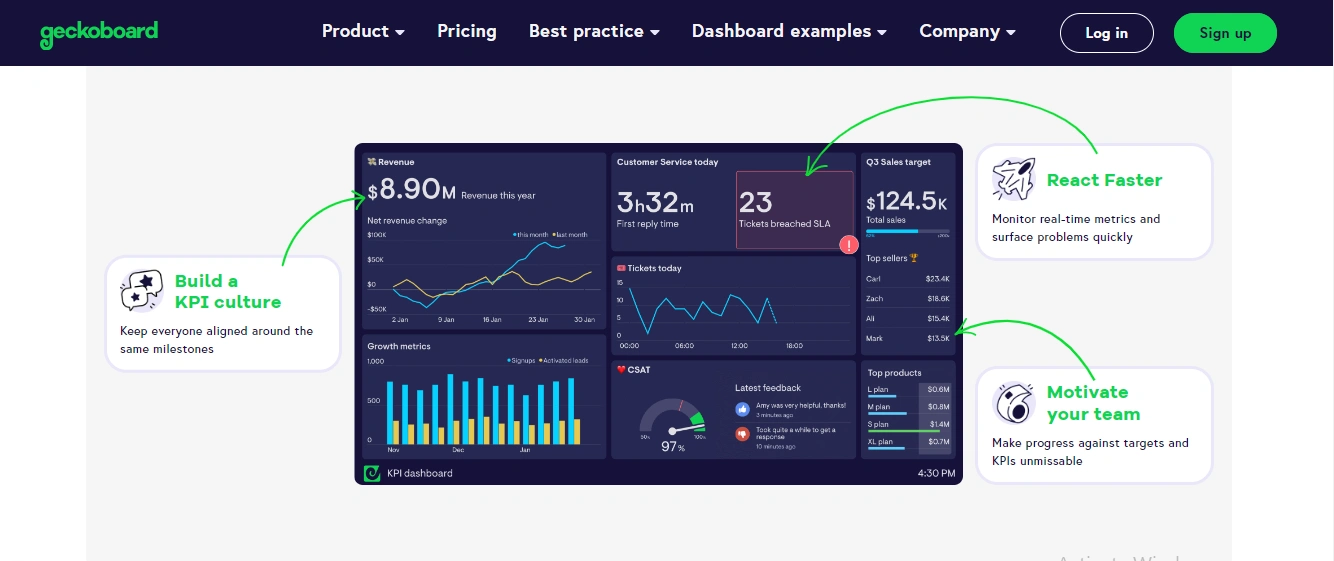
Geckoboard is a powerful tool for businesses looking to improve their data-driven decision-making processes through real-time dashboards.
Its user-friendly interface, extensive integrations, and focus on simplicity make it a great choice for teams that need to visualize and share key metrics quickly and efficiently.
However, it may not be the best fit for organizations requiring advanced analytics or those on a limited budget. Overall, Geckoboard is well-suited for companies of all sizes that value clear, accessible data visualization to drive performance.
Reasons to Buy:
- Real-Time Data Visualization: Geckoboard specializes in creating real-time KPI dashboards that help teams track key performance metrics across various business functions. This makes it ideal for organizations that need up-to-the-minute data to make informed decisions.
- User-Friendly Interface: The platform offers a highly intuitive drag-and-drop interface, making it easy for users to build and customize dashboards without requiring technical expertise.
- Extensive Integrations: Geckoboard supports over 80 integrations, including popular tools like Google Sheets, Salesforce, Mailchimp, and Zendesk, allowing users to pull data from multiple sources effortlessly.
- Customizable Dashboards: Users can easily customize dashboards with a wide variety of visualizations, including charts, graphs, and widgets, ensuring the data is presented in the most effective way for their specific needs.
- Flexible Sharing Options: Geckoboard allows users to share dashboards securely with teams or clients via unique URLs or even display them on TVs for team-wide visibility, enhancing transparency and alignment.
What Sets Geckoboard Apart:
- Focus on Simplicity and Accessibility: Geckoboard is designed to make complex data simple and accessible. Its dashboards are not only easy to create but also easy to interpret, which helps foster a data-driven culture within organizations.
- Industry-Specific Solutions: The platform provides pre-built templates and widgets tailored to specific industries and roles, such as sales, marketing, and customer support, making it easier for users to get started quickly.
- Dashboard Loops: This feature allows users to cycle through multiple dashboards on a single display, ensuring that all relevant metrics are visible without needing to switch screens manually.
- IP Whitelisting for Security: Geckoboard offers the ability to restrict dashboard access by IP address, adding an extra layer of security for sensitive data.
What It Lacks:
- Limited Advanced Features: While Geckoboard excels at basic data visualization and dashboard creation, it lacks some of the advanced analytics and reporting features found in more comprehensive business intelligence tools.
- Pricing Tiers: The cost can escalate quickly, especially for larger teams needing multiple dashboards and users. This may make it less attractive for smaller businesses with tighter budgets.
- Dependency on Third-Party Tools: Geckoboard relies heavily on integrations with other tools to pull in data, meaning its effectiveness is somewhat dependent on the quality and availability of those integrations.
Databox.Com: A Top Tool for Business Performance Monitoring
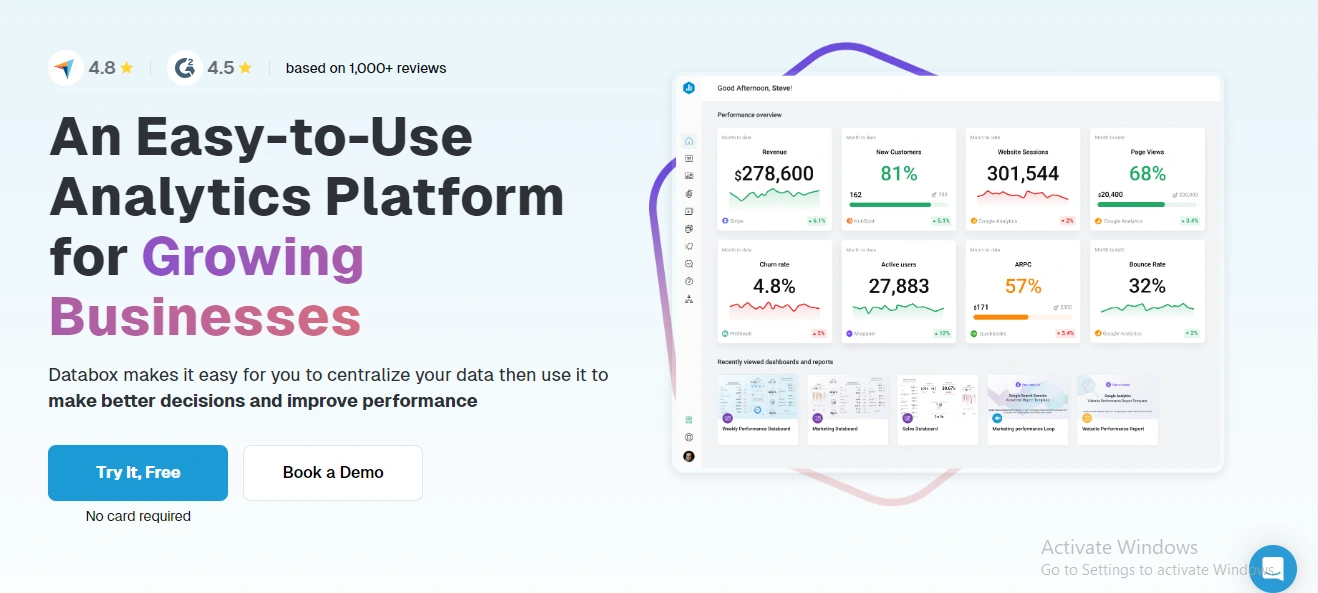
Databox is a versatile and powerful tool that excels in centralizing data from various sources and providing real-time insights into business performance.
Its user-friendly interface, extensive integrations, and customizable dashboards make it an excellent choice for businesses of all sizes looking to improve their data-driven decision-making processes.
However, the initial setup and optimization of certain integrations may require some time and effort, and users should carefully consider the features included in each pricing tier to ensure it meets their needs. Overall, Databox is a highly effective solution for businesses seeking to streamline their performance monitoring and reporting efforts.
Reasons to Buy:
- User-Friendly Interface: Databox offers an intuitive drag-and-drop interface, making it easy for users to create and customize dashboards without needing advanced technical skills.
- Comprehensive Integrations: With over 70 integrations available, Databox seamlessly connects to a wide range of data sources, including Google Analytics, HubSpot, Salesforce, and more. This makes it ideal for businesses that need to centralize data from multiple platforms.
- Customizable Dashboards: Databox allows users to design highly personalized dashboards that can be optimized for different display devices, from desktops to mobile devices and even TVs.
- Real-Time Data and Alerts: The platform provides real-time updates and automated alerts, ensuring that teams are always informed of the latest performance metrics and can act quickly on emerging trends.
- No Coding Required: Databox is designed to be accessible, even for non-technical users, allowing businesses to leverage powerful analytics tools without the need for coding or complex setup.
What Sets Databox Apart:
- Goal Tracking and Visualization: One of Databox’s standout features is its ability to track goals by allowing users to set targets for specific metrics and automatically compare them with real-time data. This enables businesses to keep a close eye on their progress and make informed decisions based on their goals.
- Multi-Platform Access: Databox’s versatility extends to its multi-platform accessibility, supporting a wide range of devices, including desktops, mobile devices, and even wearables like the Apple Watch, which allows teams to stay connected with their performance metrics on the go.
- Highly Customizable Reporting: The platform offers extensive options for customizing reports, including the ability to create custom metrics and use pre-built templates, making it a powerful tool for data-driven decision-making.
What It Lacks:
- Complex Integrations: While Databox supports a wide range of integrations, some users find that optimizing these integrations can be challenging, especially when dealing with more complex data sources.
- Initial Setup Time: Although Databox is generally user-friendly, some users report that the initial setup, particularly when configuring multiple data sources, can be time-consuming and may require a learning curve.
- Limited Dashboard Count on Lower Plans: Users on the lower-tier plans may find the number of dashboards they can create to be restrictive, which could be a limitation for teams needing extensive data visualization capabilities.
Hive.Com: A Top Tool for Business Performance Monitoring

Hive is a powerful and versatile tool for businesses looking to improve their project management and team collaboration.
Its user-friendly interface, extensive integrations, and customizable workflows make it a top choice for organizations seeking to streamline their operations and boost productivity.
However, potential users should be prepared for some initial setup time and consider the cost of scaling Hive to meet their specific needs. Overall, Hive stands out as an excellent option for businesses of all sizes that value flexibility, ease of use, and strong communication tools.
Reasons to Buy:
- All-in-One Project Management: Hive offers a comprehensive suite of project management tools, including task management, time tracking, and team collaboration, making it ideal for businesses looking to centralize their project workflows.
- Intuitive User Interface: The platform is designed with ease of use in mind, featuring a drag-and-drop interface that allows even non-technical users to quickly set up and manage projects.
- Extensive Integrations: Hive integrates with over 1,000 popular apps and services, such as Gmail, Slack, Salesforce, and Google Drive, making it easy to streamline workflows and centralize data from multiple sources.
- Customizable Workflows: Users can create tailored workflows to fit the specific needs of their teams, ensuring that tasks are completed efficiently and in alignment with company goals.
- Real-Time Collaboration: Hive’s tools for real-time updates, commenting, and file sharing enable seamless collaboration among team members, whether they are in the office or working remotely.
What Sets Hive Apart:
- Comprehensive View Options: Hive provides multiple ways to view and manage projects, including Gantt charts, Kanban boards, calendar views, and table views, allowing users to choose the format that best suits their workflow.
- Advanced Time Management: Hive’s time tracking features are particularly robust, allowing users to set time estimates, track actual time spent on tasks, and automate recurring actions to save time.
- Highly Flexible and Scalable: The platform is suitable for businesses of all sizes, from small startups to large enterprises, and its flexibility allows it to adapt to the specific needs of different industries and teams.
- Strong Focus on Communication: Hive excels in team communication, offering built-in chat, email integration, and real-time notifications, ensuring that all team members are on the same page.
What It Lacks:
- Initial Setup Time: Some users may find that the initial setup and configuration of Hive, particularly when integrating multiple third-party apps, can be time-consuming and requires a learning curve.
- Limited Advanced Reporting: While Hive offers basic reporting tools, it may lack some of the advanced analytics and reporting features found in more specialized business intelligence platforms.
- Cost Considerations: The cost of Hive can escalate quickly for larger teams or organizations requiring more advanced features and additional integrations, which may be a drawback for smaller businesses with limited budgets.
Checkmk.Com: A Top Tool for Business Performance Monitoring
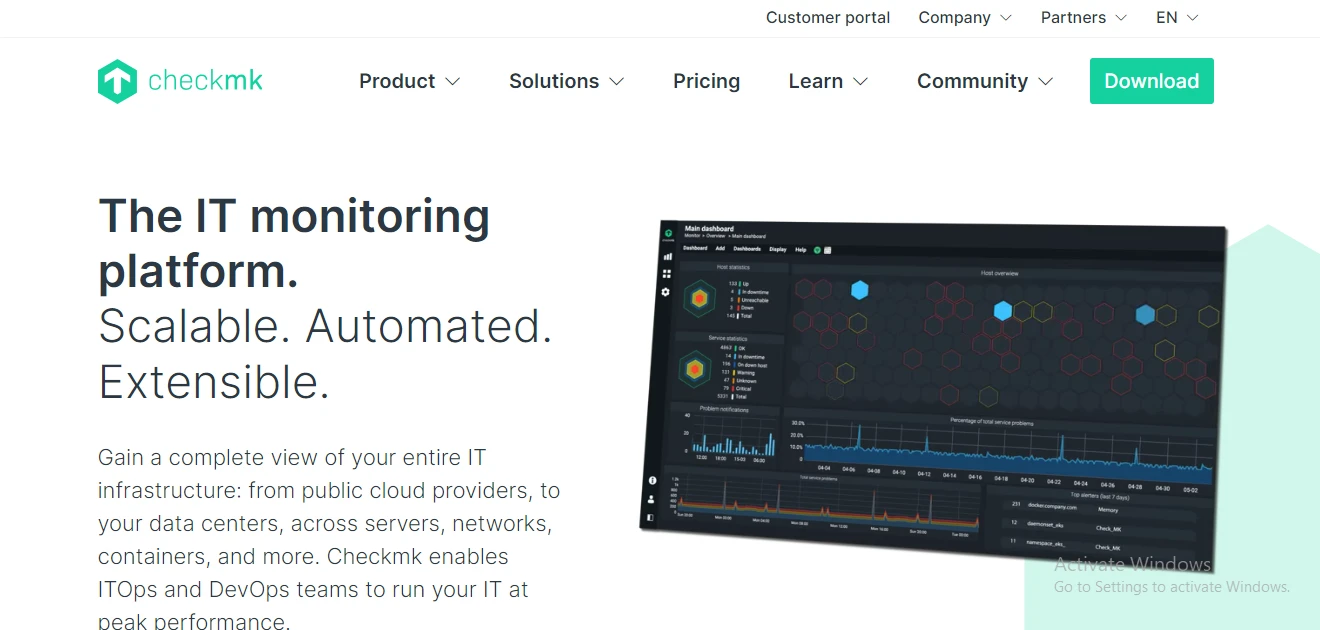
Checkmk is a robust and versatile monitoring tool well-suited for organizations of all sizes that require comprehensive monitoring across their IT infrastructure.
Its scalability, extensive integration options, and powerful network monitoring features make it a top choice for businesses seeking to ensure optimal performance and reliability.
However, potential users should be prepared for a learning curve and consider whether the platform’s reporting capabilities meet their specific needs. Overall, Checkmk stands out as a reliable and feature-rich option for business performance monitoring.
Reasons to Buy:
- Comprehensive Monitoring Capabilities: Checkmk offers extensive monitoring for servers, applications, cloud infrastructure, networks, and databases, making it an all-in-one solution for IT infrastructure monitoring.
- Highly Scalable: Whether you’re a small business or a large enterprise, Checkmk scales to meet your needs with more than 2,000 preconfigured checks and support for distributed monitoring, ensuring performance is consistent across multiple locations.
- Open-Source and Commercial Versions: Checkmk provides both open-source and enterprise versions, offering flexibility depending on your budget and feature requirements.
- Robust Integration Options: With support for over 1,000 integrations, Checkmk allows seamless data collection and analysis from various platforms, enhancing its functionality and making it easier to incorporate into existing workflows.
- Efficient Rule-Based Configuration: The platform’s rule-based configuration system simplifies the setup process, particularly for large and complex environments, by allowing users to apply monitoring rules across similar devices or services without individual configuration.
What Sets Checkmk Apart:
- Deep Network Monitoring: Checkmk excels in network monitoring, offering detailed insights into bandwidth usage, VPN tunnel states, and network flow analysis. It also integrates with tools like ntop for more granular network traffic analysis, making it ideal for businesses needing in-depth network visibility.
- Customizable Dashboards and Alerts: Users can create highly tailored dashboards and set up specific alerts based on thresholds and conditions relevant to their operations, providing a customizable and responsive monitoring environment.
- Distributed Monitoring Support: For organizations operating in multiple locations, Checkmk’s distributed monitoring capability ensures that all sites are covered under a single monitoring instance, streamlining the management process.
What It Lacks:
- Steep Learning Curve: Although powerful, Checkmk has a steep learning curve, particularly for users unfamiliar with IT infrastructure monitoring tools. It may require a significant time investment to fully leverage its capabilities.
- Complex User Interface: Some users find the interface less intuitive compared to other monitoring solutions, particularly when navigating through historical data or configuring advanced features.
- Limited Out-of-the-Box Reporting: While Checkmk provides essential monitoring features, its reporting capabilities may not be as advanced as those offered by competitors, potentially necessitating third-party tools or custom solutions for more detailed analytics.

