Data drives growth. But without the right tools, it’s just noise.
Did you know that companies using advanced analytics are twice as likely to be in the top quartile of financial performance in their industries? If you’re serious about scaling your business, understanding which analytics tools can unlock these insights is crucial.
From real-time data processing to predictive modeling, the right tools can transform how you make decisions.
Ready to dive into the top analytics tools that can propel your business forward? Let’s explore the essentials for growth in today’s competitive landscape.
Google Analytics (GA4) for Business Growth
Google Analytics has been a cornerstone of digital analytics for many businesses, providing valuable insights into website traffic, user behavior, and marketing effectiveness. However, with the transition from Universal Analytics (UA) to Google Analytics 4 (GA4), there are several factors to consider when evaluating its suitability for your business in 2024.
Reasons to Buy:
- Free Access to Robust Analytics: Google Analytics remains a free tool that offers an extensive range of features, making it accessible for businesses of all sizes. This is particularly beneficial for startups and small businesses looking to maximize their insights without a hefty investment.
- Integration with Google Products: GA4 integrates seamlessly with other Google services like Google Ads and BigQuery, allowing for comprehensive data analysis and better-informed marketing strategies.
- Advanced Machine Learning Capabilities: GA4 includes enhanced machine learning features such as predictive metrics and automated insights, helping businesses anticipate trends and optimize their marketing efforts.
- User-Centric Data Tracking: GA4’s focus on event-based data and user-centric tracking across multiple devices offers a more holistic view of customer journeys, providing deeper insights into user behavior.
- Improved Privacy Controls: GA4 is designed with modern privacy regulations in mind, offering advanced data controls to comply with GDPR and CCPA, which is crucial for businesses operating in multiple regions.
What Sets GA4 Apart:
- Event-Based Data Model: Unlike its predecessor, GA4 uses an event-based data model, which allows for more flexible tracking of user interactions across platforms and devices. This shift provides businesses with greater flexibility in defining and analyzing custom events.
- Cross-Platform Tracking: GA4 enables tracking across both websites and mobile apps, offering a unified view of user interactions. This is particularly beneficial for businesses with a multi-channel presence.
- Customizable Reporting: GA4 provides a more customizable approach to reporting, allowing users to create reports tailored to specific business needs and goals. This includes the ability to explore data in greater depth with new tools and interfaces.
What It Lacks:
- Steep Learning Curve: The transition to GA4 comes with a significant learning curve. Many users find the new interface and the shift from session-based to event-based tracking confusing, especially when trying to replicate reports that were simpler in Universal Analytics.
- Data Integration Challenges: Integrating GA4 data with legacy Universal Analytics data can be difficult due to differences in the data models. This poses challenges for businesses that rely on historical data for long-term analysis.
- Potential Data Inaccuracies: GA4 uses data sampling for large datasets, which can lead to inaccuracies if not configured correctly. This is a critical issue for businesses that depend on precise data for decision-making.
- Performance Impact: The scripts used by GA4 can be heavy, potentially affecting website performance, particularly in terms of page load speed. This is an important consideration for businesses where speed is critical for user experience.
Microsoft Power BI for Business Growth
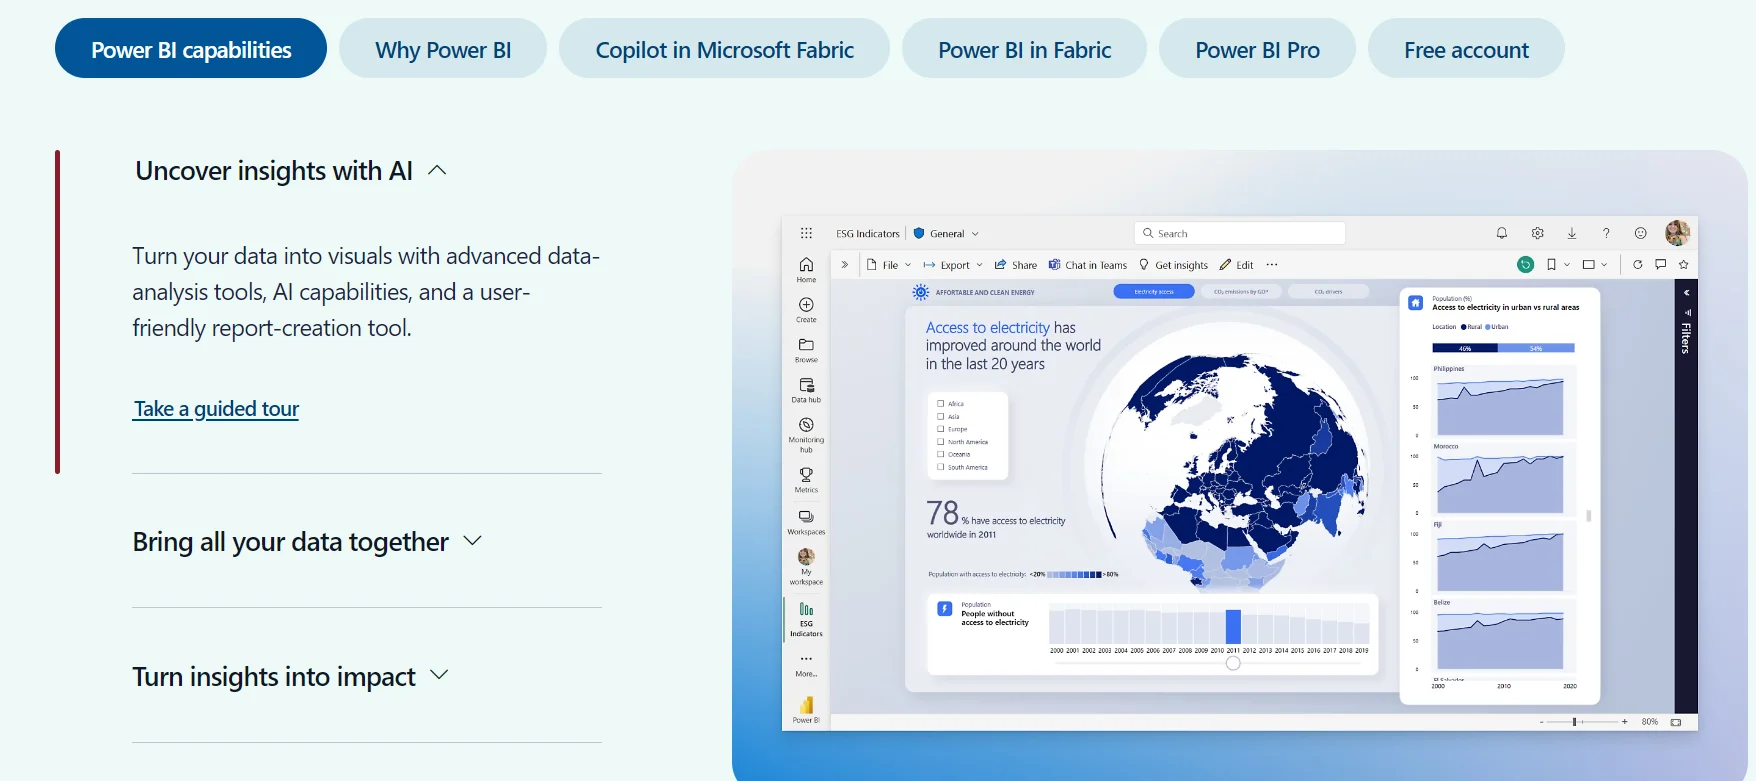
Microsoft Power BI is a leading business analytics tool designed to provide interactive visualizations and business intelligence capabilities with an interface simple enough for end users to create their own reports and dashboards. As one of the most popular tools in its category, Power BI is widely adopted by organizations looking to leverage data for informed decision-making.
Reasons to Buy:
- Seamless Integration with Microsoft Ecosystem: Power BI integrates flawlessly with other Microsoft products like Excel, Azure, and Teams, making it an ideal choice for businesses already invested in Microsoft’s ecosystem.
- Cost-Effective Solution: Compared to other leading BI tools, Power BI offers a more budget-friendly pricing model, starting as low as $10 per user per month. This makes it accessible to small and midsize businesses.
- Advanced Data Analytics Capabilities: Power BI supports complex data modeling, DAX functions, and custom visualizations, making it a powerful tool for handling large datasets and detailed analytics.
- Scalability: Power BI is highly scalable, making it suitable for both small teams and large enterprises. It supports advanced features like real-time dashboards and extensive data modeling capabilities.
- User-Friendly with Learning Resources: Despite its extensive features, Power BI offers numerous tutorials and a drag-and-drop interface, which helps both beginners and experienced users get up to speed quickly.
What Sets Power BI Apart:
- Integration with Microsoft Tools: The seamless integration with Microsoft’s other products sets Power BI apart from many other analytics tools. This integration allows for a unified experience across platforms, enhancing productivity and collaboration.
- Real-Time Data Updates: Power BI offers real-time data updates and scheduled data refreshes, ensuring that businesses have access to the most current information for decision-making.
- Custom Visualizations and Advanced Data Modeling: Power BI provides robust customization options, allowing users to create highly tailored reports and visualizations that meet specific business needs. Its support for DAX functions enables in-depth data analysis, making it particularly powerful for complex data scenarios.
What It Lacks:
- Steep Learning Curve for Advanced Features: While Power BI is accessible for basic reporting, its more advanced features, such as custom visualizations and DAX function writing, require significant expertise. This can present a steep learning curve for users who are not familiar with business intelligence tools.
- Performance Issues: Power BI can be resource-intensive, particularly when handling large datasets, which may lead to slower performance. Additionally, its interface can sometimes feel less intuitive compared to other BI tools.
- Limited Collaboration Features: The platform’s collaboration features are somewhat limited, particularly when it comes to simultaneous editing and cross-platform functionality. Sharing reports with others often requires additional licenses, which can add to the overall cost.
- Dependency on Microsoft Environment: While integration with Microsoft products is a strength, it can also be a limitation for organizations not fully embedded in the Microsoft ecosystem. The tool’s effectiveness diminishes if the business relies heavily on non-Microsoft platforms.
Tableau.com Review: A Top Analytics Tool for Business Growth
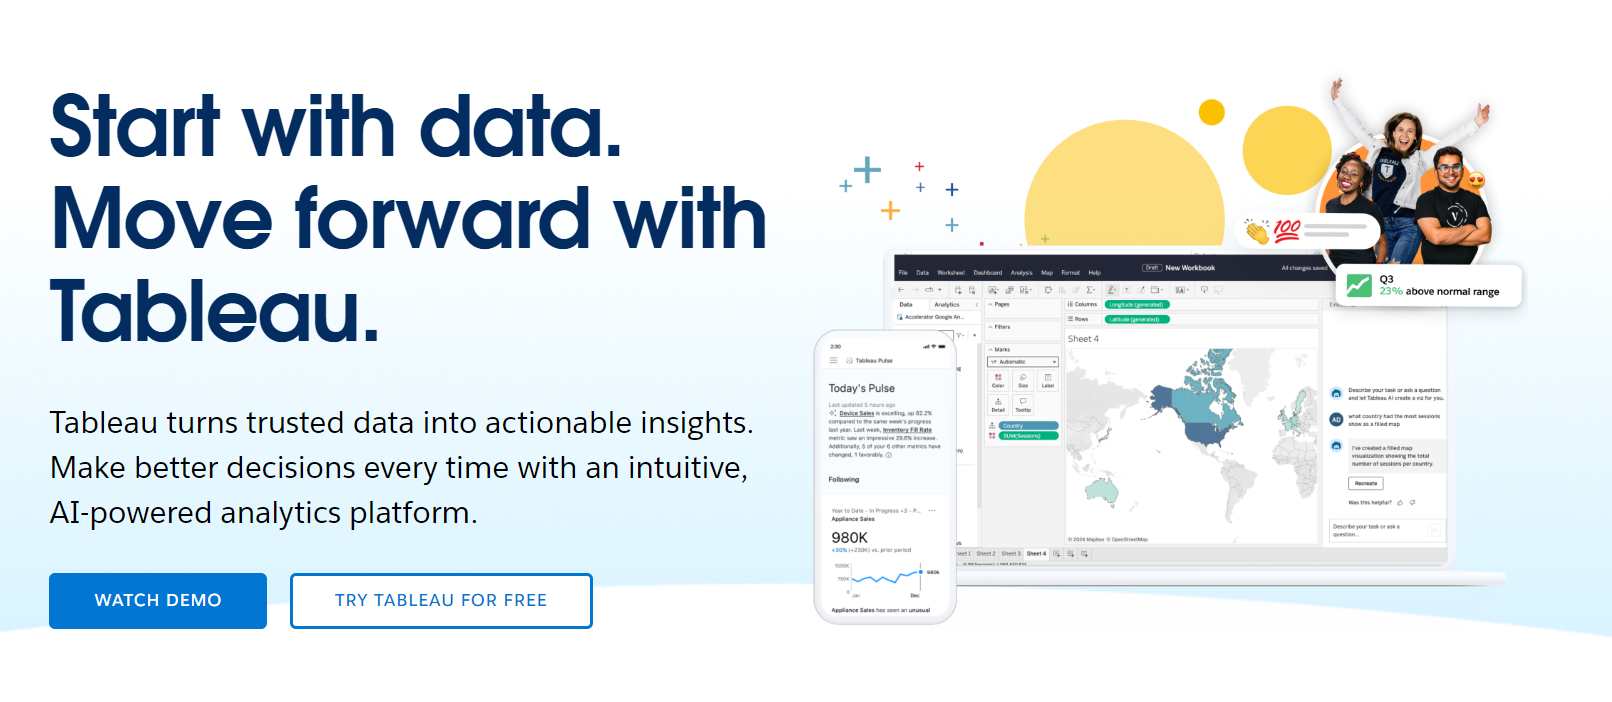
Tableau is a well-established leader in the field of business intelligence (BI) and data visualization, offering robust features that cater to organizations of all sizes. Here’s an expert review of Tableau in the context of top analytics tools for business growth.
Reasons to Buy
- Powerful Data Visualization: Tableau is renowned for its ability to transform complex data into intuitive, interactive visualizations. Its extensive library of visualization options, including geo-visualizations and animated charts, allows users to explore data in innovative ways.
- Scalability: Tableau’s architecture is highly scalable, making it suitable for both small businesses and large enterprises. It can handle vast amounts of data, which is essential for organizations that need to process and analyze big datasets.
- Comprehensive Data Integration: Tableau offers a wide range of connectors that enable users to blend data from multiple sources, including databases, cloud services, and spreadsheets. This ensures a cohesive view of business operations, enhancing decision-making.
- Advanced Analytics with AI Integration: With the integration of Salesforce’s Einstein Analytics, Tableau now includes AI-driven features like Tableau Pulse and Explain Data, which provide automated insights and predictive analytics capabilities.
- Strong Community and Support: Tableau has a vibrant user community and extensive resources, including online forums, tutorials, and case studies. This support network is invaluable for users at all levels of expertise.
What Sets Tableau Apart
- Tableau Prep for Data Cleaning: Tableau Prep is a powerful module that allows users to clean, shape, and transform data with ease. It supports advanced functions, such as data blending and the integration of R and Python scripts for more complex analyses.
- User-Focused Design: Tableau’s drag-and-drop interface makes it accessible to users with varying levels of technical expertise. This ease of use, combined with its ability to handle complex visualizations, sets Tableau apart from many of its competitors.
- Cloud and On-Premises Flexibility: Tableau offers both cloud-based and on-premises deployment options, giving organizations the flexibility to choose the setup that best fits their needs. This is particularly beneficial for companies with specific security or compliance requirements.
What It Lacks
- Steep Learning Curve: While Tableau is user-friendly for basic tasks, mastering its advanced features can be challenging. Users who require deep data analysis may find themselves needing additional training or support to fully leverage the platform.
- Performance with Large Datasets: Some users have reported slower performance when working with particularly large datasets or complex dashboards. This can be a drawback for organizations that rely on real-time data processing and need quick insights.
- High Cost: Tableau’s pricing can be a barrier for smaller businesses. The cost for licenses, particularly for enterprise-level features, can add up quickly, making it a significant investment compared to other BI tools.
Kissmetrics.io Review: A Comprehensive Guide to a Leading Analytics Tool for Business Growth

Kissmetrics is a powerful customer analytics and engagement platform designed to help businesses understand their customers’ behaviors, optimize marketing efforts, and drive growth. Tailored primarily for e-commerce, SaaS companies, and digital marketers, Kissmetrics offers a suite of tools that provide deep insights into customer journeys, retention rates, and conversion metrics. This expert review delves into Kissmetrics’ features, strengths, limitations, pricing, and its role in fostering business growth.
Reasons to Buy
- Customer-Centric Analytics: Unlike traditional web analytics tools that focus on page views and sessions, Kissmetrics emphasizes understanding individual customer behaviors over time. This approach enables businesses to track user interactions across multiple devices and touchpoints, providing a holistic view of the customer journey.
- Advanced Segmentation: Kissmetrics allows users to segment their audience based on various attributes and behaviors. This granular segmentation facilitates targeted marketing campaigns, personalized user experiences, and improved customer retention strategies.
- Behavioral Cohorting: By grouping users based on specific behaviors or characteristics, businesses can analyze patterns and trends within these cohorts. This feature is invaluable for identifying factors that drive customer retention, conversion, and lifetime value.
- Funnel Analysis: Kissmetrics provides robust funnel analysis tools that help businesses identify drop-off points in their conversion processes. By visualizing each step of the funnel, companies can pinpoint areas for optimization to enhance conversion rates.
- A/B Testing Integration: The platform integrates seamlessly with A/B testing tools, enabling businesses to test different variations of their website or app elements. This integration supports data-driven decision-making to improve user experiences and increase conversions.
What Sets Kissmetrics Apart
- Lifetime Customer Value Tracking: Kissmetrics excels in tracking the lifetime value (LTV) of customers. By understanding the long-term value of different customer segments, businesses can allocate resources more effectively and focus on strategies that maximize profitability.
- Behavioral Event Tracking: The platform allows for detailed tracking of specific user actions, such as button clicks, form submissions, and page navigations. This granular data collection helps businesses understand exactly how users interact with their products or services.
- Automated Reporting: Kissmetrics offers customizable and automated reporting features. Users can set up dashboards that update in real-time, providing up-to-date insights without manual intervention.
- Integration Capabilities: Kissmetrics integrates with a wide range of third-party tools, including CRM systems, email marketing platforms, and e-commerce solutions. This interoperability ensures that businesses can consolidate their data and workflows seamlessly.
What It Lacks
- Limited Data Visualization Options: While Kissmetrics provides essential visualization tools for analyzing data, it may not offer the same depth and variety of visualization options as some competitors like Tableau or Power BI. Users seeking highly customized or advanced visualizations might find this limiting.
- Steeper Learning Curve: For users new to customer analytics platforms, Kissmetrics can present a steeper learning curve compared to more user-friendly tools. Comprehensive training or onboarding may be necessary to fully leverage its capabilities.
- Pricing Transparency: Kissmetrics does not publicly disclose its pricing structure, which can make it challenging for potential users to assess affordability upfront. Interested businesses typically need to contact the sales team for a customized quote based on their specific needs.
- Focus on E-commerce and SaaS: While Kissmetrics is highly effective for e-commerce and SaaS businesses, organizations in other industries might find that some features are less relevant to their specific analytics needs.
Pricing
Kissmetrics offers tiered pricing plans tailored to different business sizes and requirements. Although specific pricing details are not publicly available, the general structure includes:
- Basic Plan: Designed for small businesses and startups, this plan includes essential analytics features, customer segmentation, and basic reporting tools.
- Growth Plan: Aimed at growing businesses, this plan offers advanced features such as behavioral cohorting, funnel analysis, and enhanced reporting capabilities.
- Enterprise Plan: Geared towards large organizations, the enterprise plan includes all features, priority support, and customization options to meet complex business needs.
Prospective users are encouraged to contact Kissmetrics directly to obtain a personalized quote and discuss the best plan for their business.
Use Cases
- E-commerce Optimization: Online retailers use Kissmetrics to track customer behaviors, optimize product pages, and reduce cart abandonment rates. By analyzing purchase patterns and user journeys, businesses can enhance their marketing strategies and increase sales.
- SaaS Customer Retention: Software-as-a-Service companies leverage Kissmetrics to monitor user engagement, identify churn risks, and implement retention strategies. Understanding how users interact with their platforms helps SaaS businesses improve their offerings and customer satisfaction.
- Marketing Campaign Analysis: Digital marketers utilize Kissmetrics to assess the effectiveness of their campaigns. By tracking conversions, user interactions, and ROI, marketers can refine their strategies for better performance.
- Product Development Insights: Product teams use the platform to gather insights into how customers use their products. This data informs feature development, user experience improvements, and overall product strategy.
Hotjar Review: An Expert Guide for Business Growth
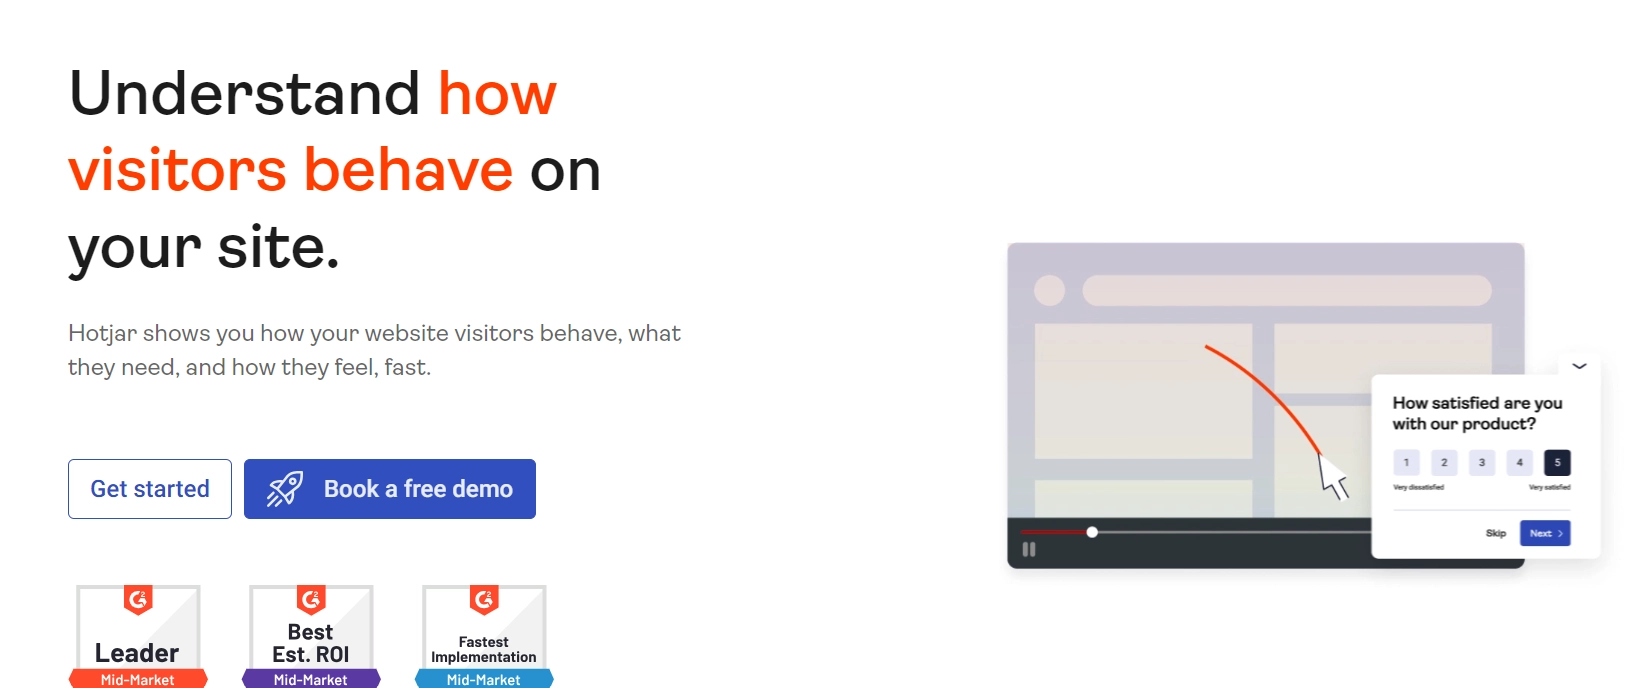
Hotjar is a powerful analytics tool widely used for understanding user behavior and optimizing website experiences. It offers a range of features, including heatmaps, session recordings, conversion funnel analysis, and feedback surveys, making it an essential tool for businesses looking to improve user engagement and increase conversions. Below is a comprehensive review of Hotjar, detailing why it is a top choice for business growth, what sets it apart, and some areas where it might fall short.
Reasons to Buy Hotjar:
- Comprehensive User Insights: Hotjar provides deep insights into user behavior through its heatmaps and session recordings. These features allow businesses to see exactly where users are clicking, how they navigate through pages, and where they encounter issues, enabling targeted improvements to user experience.
- Easy to Use: The platform is known for its user-friendly interface, making it accessible even for those without extensive technical knowledge. This ease of use extends across its various tools, including feedback polls and surveys, which are straightforward to implement and analyze.
- Flexible Pricing Plans: Hotjar offers a range of pricing plans, including a free tier that is ideal for small businesses. Paid plans start at $39 per month, scaling up based on the number of sessions or responses needed. This flexibility makes it a viable option for businesses of different sizes.
- Real-Time Feedback Collection: With tools like feedback polls and incoming feedback widgets, Hotjar enables businesses to gather real-time user opinions. This direct feedback is invaluable for identifying pain points and opportunities for improvement.
- Session Recordings: Hotjar’s session recording feature is particularly robust, allowing businesses to view user interactions on their websites in detail. This can highlight areas where users struggle and where the user experience can be enhanced.
What Sets Hotjar Apart:
- Heatmap Precision: Unlike some competitors, Hotjar not only tracks clicks but also mouse movements, giving a more comprehensive view of user interactions. This level of detail helps businesses understand how users engage with different elements on their pages.
- Integrated User Feedback Tools: Hotjar combines analytics with user feedback tools, allowing businesses to correlate quantitative data with qualitative insights. This integrated approach makes it easier to identify and address user experience issues.
- Ease of Integration: Hotjar integrates seamlessly with other major tools like Google Analytics, allowing businesses to enhance their existing analytics setup with additional insights from Hotjar. This integration helps create a more holistic view of user behavior.
What Hotjar Lacks:
- Limited Depth in Form Analytics: While Hotjar offers form analysis as part of its conversion rate optimization tools, it does not provide as much detail as specialized form analytics tools. Businesses requiring deep form insights might find this feature somewhat lacking.
- Basic Funnel Analysis: Hotjar’s conversion funnel analysis provides a good starting point for identifying drop-off points but lacks the depth and flexibility of more advanced analytics tools. Businesses looking for detailed funnel insights may need to complement Hotjar with other tools.
- Customization of Surveys: Some users have noted that Hotjar’s surveys and feedback tools feel like third-party applications and lack customization options to blend seamlessly with the rest of their website’s design.
Zoho Analytics: A Top Tool for Business Growth
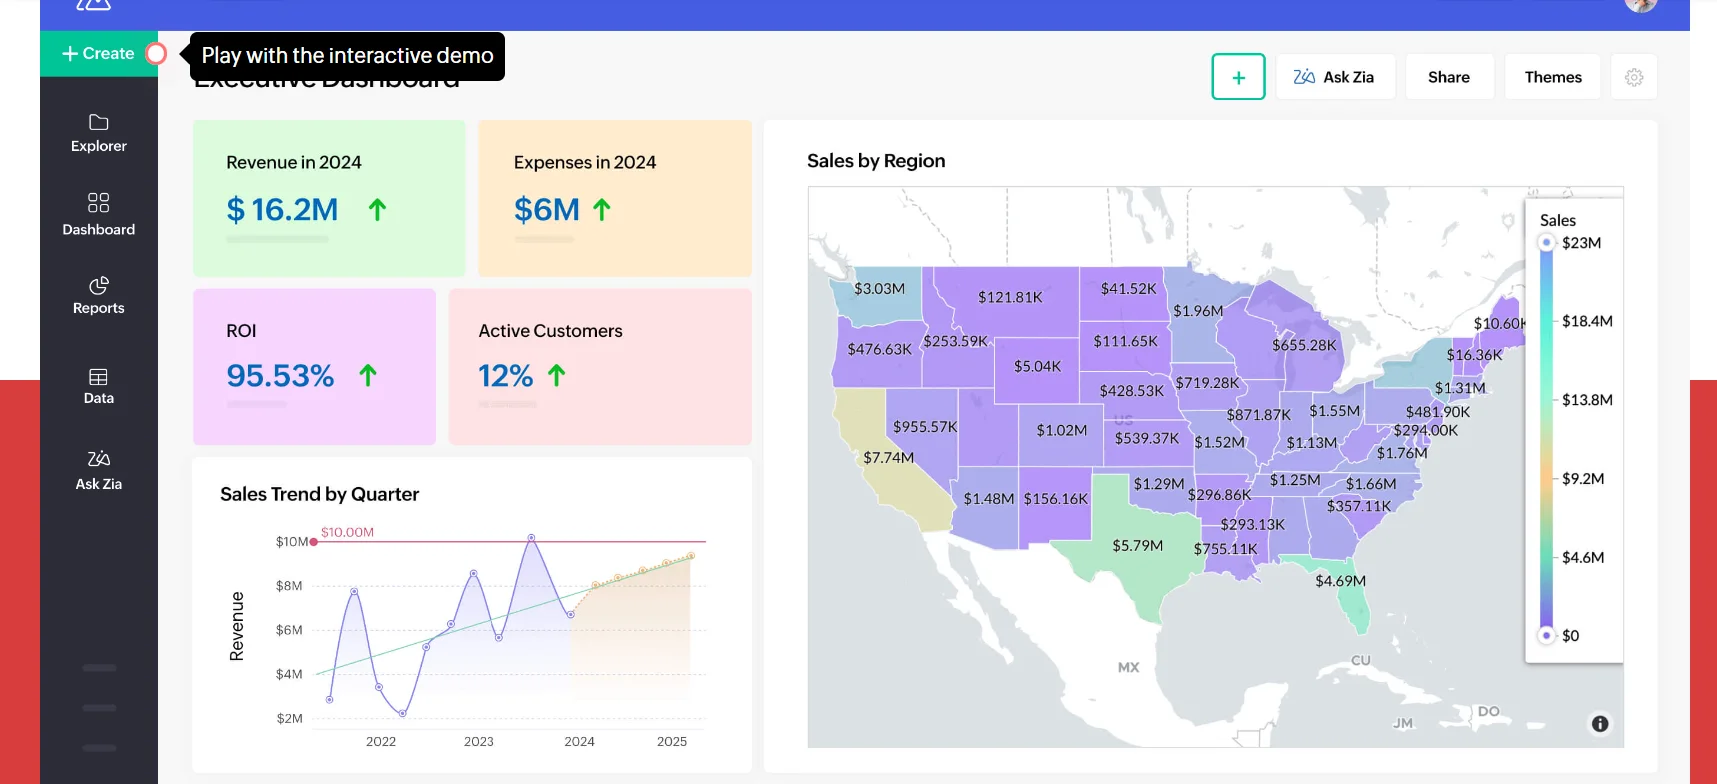
Zoho Analytics is a cloud-based business intelligence (BI) and data analytics platform designed to help businesses of all sizes gain actionable insights from their data. It is particularly well-suited for small to medium-sized businesses (SMBs) due to its affordability and seamless integration with the broader Zoho ecosystem.
Reason to Buy:
- User-Friendly Interface: Zoho Analytics is designed with ease of use in mind, making it accessible even for those with minimal technical expertise. The intuitive drag-and-drop interface allows for quick creation of dashboards and reports, reducing the need for IT intervention.
- Comprehensive Integrations: The tool supports seamless integration with various business applications, including Zoho’s ecosystem, Salesforce, G Suite, and more. This ensures a smooth flow of data across platforms, enhancing the overall analytics capabilities.
- Cost-Effective: Zoho Analytics offers robust features at a competitive price point, making it an attractive option for small to medium-sized businesses looking to maximize their analytics capabilities without breaking the bank.
- Augmented Analytics with AI: The platform includes advanced AI-driven features like ZIA Insights, which allows users to interact with their data using natural language queries. This feature helps in uncovering hidden insights without the need for advanced analytical skills.
- Strong Data Security: Zoho Analytics emphasizes data security with features like SSL encryption, role-based access control, and compliance with GDPR and HIPAA, providing peace of mind when handling sensitive data.
What Sets Zoho Analytics Apart:
- Versatility Across Industries: Zoho Analytics is highly adaptable, with successful use cases across various sectors, including marketing, finance, healthcare, and education. This versatility makes it a go-to solution for diverse business needs.
- Extensive Customization Options: The tool offers extensive customization for reports and dashboards, allowing businesses to tailor their analytics environment to specific needs. This flexibility is further enhanced by the availability of custom connectors and APIs.
- Mobile and Remote Access: Zoho Analytics supports mobile BI, allowing users to access real-time data and collaborate remotely. This feature is particularly beneficial for businesses with a mobile workforce or those requiring continuous access to data from various locations.
What It Lacks:
- Mobile Experience: While Zoho Analytics does offer mobile access, the user interface and experience on small devices could be improved. Users have reported that the mobile dashboard lacks some of the interactivity and responsiveness found in the desktop version.
- Learning Curve for Advanced Features: Although the platform is generally user-friendly, there is a learning curve associated with mastering its more advanced features, particularly for users unfamiliar with BI tools.
- Limited AI Capabilities: While Zoho Analytics includes AI-driven features, it lags behind competitors like Tableau and Power BI in terms of advanced analytics and AI-powered insights. The tool could benefit from more sophisticated AI algorithms to compete with higher-end BI platforms.
Akkio.com Review: A Top Analytics Tool for Business Growth
Akkio.com is emerging as a powerful player in the analytics and AI space, particularly for businesses looking to leverage predictive analytics without the need for advanced technical expertise. Here’s an in-depth review of Akkio in the context of top analytics tools for business growth.
Reasons to Buy
- No-Code Interface: Akkio stands out for its ease of use, allowing users with no coding or machine learning experience to create and deploy predictive models quickly and efficiently.
- Affordable Pricing: Akkio offers competitive pricing tiers, including a free plan and scalable paid options starting at $49 per month, making it accessible to businesses of all sizes.
- Real-Time Data Insights: The platform provides real-time data updates, ensuring that analyses are always current and relevant, which is crucial for making informed business decisions.
- Customizable AI Solutions: Akkio offers white-labeling and integration options, allowing businesses to customize the platform to fit their specific needs and branding.
- Wide Application: From marketing agencies optimizing ad campaigns to retail consultants managing inventory, Akkio is versatile enough to cater to a wide range of industries and use cases.
What Sets Akkio Apart
- User Accessibility: Akkio democratizes AI, making advanced analytics accessible to a broader audience, including non-technical users. This is a game-changer for businesses that want to harness the power of AI without the steep learning curve typically associated with such tools.
- Streamlined Workflow: The platform simplifies complex data processes, from data preparation to model deployment, all within a user-friendly interface. This efficiency allows users to focus on decision-making rather than getting bogged down in technical details.
- Versatile Integration: Akkio offers seamless integration with various data sources and platforms, enhancing its utility across different business functions. The extensive API access further allows advanced users to develop custom solutions.
What It Lacks
- Advanced Customization: While Akkio excels in simplicity, it may fall short for more advanced users who require deeper customization and control over their machine learning models. The platform’s focus on ease of use means it may not offer the complexity needed by seasoned data scientists.
- Dependency on Data Quality: The effectiveness of Akkio’s predictive models heavily relies on the quality of the input data. Poor data quality can significantly impact the accuracy and reliability of predictions.
- Limited Offline Capabilities: Akkio primarily operates online, which could be a limitation in environments with low bandwidth or unstable internet connections.
Sisense.com: Comprehensive Review for Business Growth
Sisense has established itself as a leading business intelligence (BI) and analytics platform, particularly known for its robust capabilities in data visualization, seamless integration, and ease of use. Here’s a detailed review highlighting the reasons to buy, what sets it apart, and where it falls short:
Reasons to Buy Sisense
- In-Chip Technology: Sisense’s In-Chip technology is a game-changer, allowing for faster data processing and analysis, particularly with large and complex datasets. This technology reduces the load on RAM and CPU, making it highly efficient.
- Single-Stack Architecture: Sisense’s single-stack architecture integrates data preparation, analysis, and visualization in one platform, simplifying the workflow and eliminating the need for multiple tools.
- Ease of Use: With its drag-and-drop interface and intuitive dashboard creation, even non-technical users can easily build complex reports and visualizations without needing extensive IT support.
- Scalability: Whether you’re a small startup or a large enterprise, Sisense offers the scalability to grow with your business, handling increasing data loads and user demands efficiently.
- Real-Time Insights: Sisense provides real-time data monitoring and alerts, ensuring that businesses can react swiftly to changes in key metrics.
- Embedded Analytics: Sisense allows for white-labeling and embedding analytics into your own products, providing clients with customized BI solutions.
- AI-Driven Insights: The platform leverages AI to provide predictive analytics and natural language processing, making it easier for users to gain actionable insights from their data.
What Sets Sisense Apart
- In-Chip Technology: Unlike traditional BI tools that rely heavily on disk-based processing, Sisense’s In-Chip technology optimizes the use of CPU and RAM, dramatically speeding up data analysis and visualization.
- Integration Capabilities: Sisense excels at integrating with a wide range of data sources, including SQL databases, cloud storage, and on-premises systems, offering businesses a holistic view of their data.
- User-Friendly Dashboard Creation: Sisense allows users to create interactive dashboards with minimal technical knowledge. Its drag-and-drop functionality and pre-built widgets simplify the process of data visualization.
- Flexibility and Customization: The platform is highly customizable, with options to extend functionality through third-party integrations and add-ons, catering to specific business needs.
What It Lacks
- Steeper Learning Curve for Advanced Features: While basic functions are user-friendly, advanced features may require a deeper understanding of BI tools and coding, which could be a barrier for some users.
- High Customization May Require Technical Expertise: Although Sisense offers extensive customization, making the most of these capabilities might require technical know-how, particularly when dealing with complex data scenarios.
- Pricing Transparency: Sisense does not list its pricing publicly, which can be a drawback for small businesses looking to budget their analytics tools upfront. Potential customers need to contact the sales team for a quote, which could be seen as a hurdle.
Domo.com Review: A Top Analytics Tool
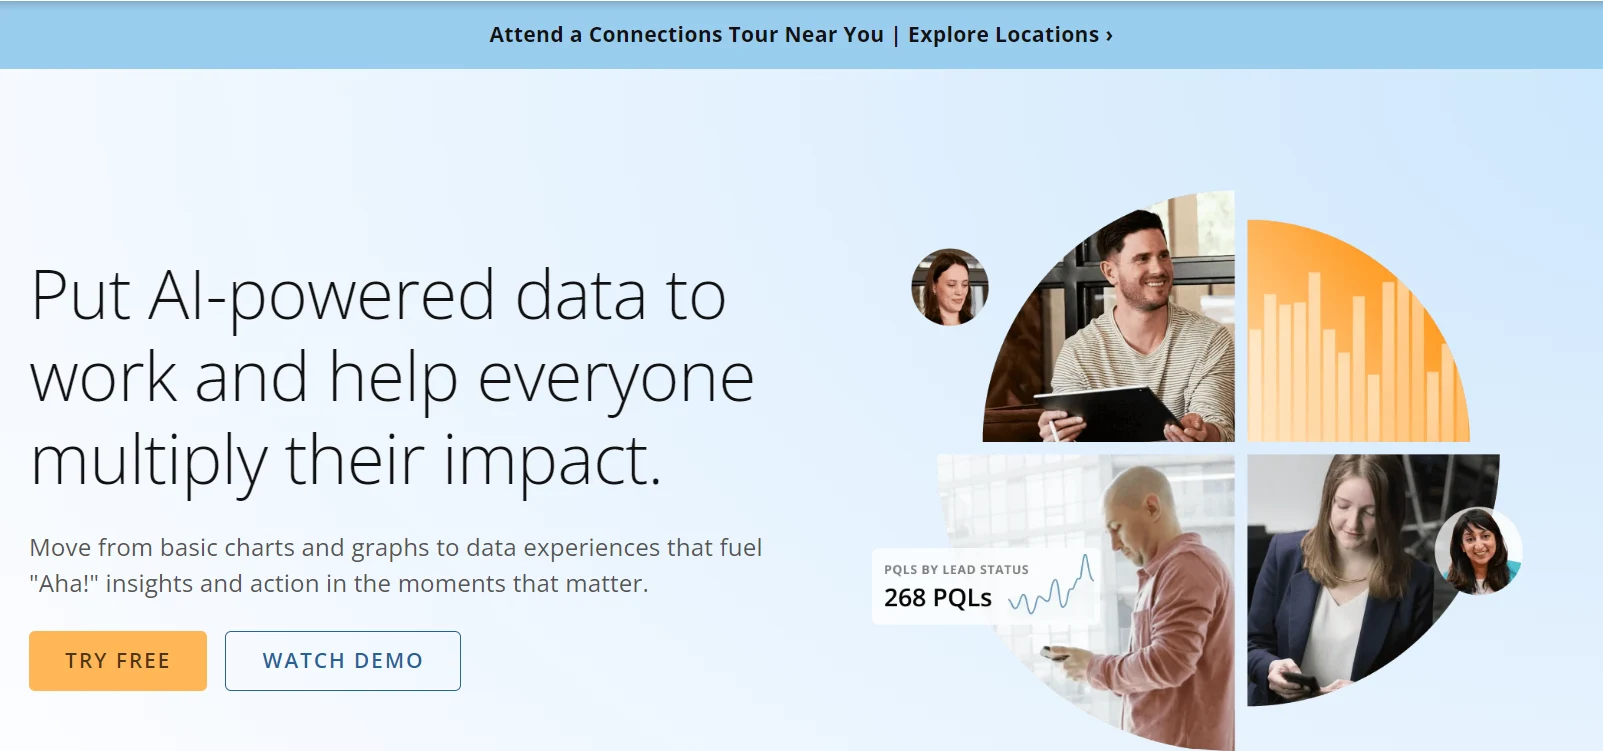
Domo.com is a cloud-based business intelligence (BI) and analytics platform that has carved out a niche in the competitive landscape of analytics tools. Known for its robust integration capabilities and user-friendly design, Domo offers a comprehensive solution for businesses looking to harness the power of data to drive growth.
Reasons to Buy
- Extensive Integration Capabilities: Domo supports over 1,000 integrations, allowing seamless connectivity with a wide range of data sources, including cloud applications, databases, and spreadsheets. This makes it an ideal choice for businesses that rely on diverse data ecosystems.
- User-Friendly Interface: Domo’s drag-and-drop dashboard builder is intuitive and accessible even for users without deep technical expertise. This ease of use extends to the platform’s visualization and reporting tools, enabling quick setup and deployment.
- Scalability and Flexibility: Designed to cater to businesses of all sizes, Domo offers flexible deployment options that can scale as your business grows. Whether you’re a small startup or a large enterprise, Domo’s platform can adapt to your needs.
- Real-Time Data and Alerts: Domo excels in providing real-time data insights and configurable alerts, allowing businesses to make timely decisions based on the most current information available.
- Collaboration and Mobile Support: Domo enhances team collaboration by providing tools that allow users to share insights and dashboards easily. Additionally, its mobile capabilities ensure that key data is accessible anytime, anywhere, on any device.
What Sets Domo Apart
- Comprehensive Data Platform: Domo is more than just a BI tool; it’s a full-fledged data experience platform. It integrates data collection, preparation, visualization, and optimization into a single, cohesive solution. This holistic approach helps businesses streamline their data workflows and enhance decision-making processes.
- Customizable Dashboards: Domo offers highly customizable dashboards, enabling users to tailor their data views according to specific project needs. This level of customization is supported by the platform’s flexible APIs, which allow for further personalization and integration with other business applications.
- Focus on Non-Technical Users: Domo is designed with a strong emphasis on self-service analytics, making it accessible to business users who may not have a background in data science. This democratization of data ensures that decision-making is informed by data across all levels of the organization.
What It Lacks
- Performance Issues with Large Datasets: While Domo is powerful, it has been noted that performance can suffer when dealing with very large datasets, particularly in terms of dashboard load times. This could be a concern for businesses that require fast, responsive analytics in high-pressure environments.
- Complex Pricing Model: Domo’s pricing is not transparent, and businesses need to contact the sales team to get a detailed quote. The platform operates on a licensing and credit system, which can be complex and potentially expensive, depending on the features and scale required.
- Learning Curve for Advanced Features: Although Domo is user-friendly for basic analytics tasks, more advanced features may require significant time and effort to master, particularly for users who are not familiar with data analytics or programming.
Lookerstudio.google.com Review

Looker Studio (formerly Google Data Studio) is a robust data visualization and analytics tool designed to help businesses turn raw data into actionable insights. Below is a comprehensive review of Looker Studio in the context of top analytics tools for business growth.
Reasons to Buy
- Seamless Integration with Google Ecosystem: Looker Studio integrates effortlessly with various Google services such as Google Analytics, Google Ads, Google Sheets, and Google BigQuery, making it an ideal choice for businesses already invested in Google’s ecosystem.
- Cost-Effective Solution: The platform offers a free version that includes a wide range of features, making it accessible to startups and small businesses looking for powerful analytics without the financial burden.
- User-Friendly Interface: Looker Studio provides a drag-and-drop interface that simplifies the process of creating and sharing data visualizations and reports. This makes it easy for non-technical users to generate insights and collaborate across teams.
- Real-Time Data Updates: The tool supports real-time data updates, ensuring that users always have the most current data available for decision-making.
- Customizable Dashboards and Reports: Users can create highly customizable dashboards and reports, allowing for tailored data views that meet specific business needs.
What Sets Looker Studio Apart
- Geospatial Mapping and Advanced Data Visualization: Looker Studio offers advanced geospatial mapping capabilities, which are particularly useful for businesses that need to analyze location-based data. This feature, combined with its comprehensive visualization options, allows businesses to gain deeper insights from their data.
- Collaboration and Sharing Tools: The platform supports real-time collaboration, enabling multiple users to edit and interact with reports simultaneously. This feature is crucial for team-based environments where collective decision-making is key.
- API Access and Custom Development: For businesses with more advanced needs, Looker Studio offers API access that allows for custom integrations and development, providing greater flexibility in how data is managed and visualized.
What It Lacks
- Performance with Large Datasets: While Looker Studio performs well with small to medium datasets, it can struggle with larger datasets, particularly when executing complex queries or visualizations. This could be a limitation for enterprises with extensive data needs.
- Limited Advanced Analytics: Looker Studio lacks some of the advanced analytics and predictive modeling features found in other BI tools like Power BI or Tableau. This may be a drawback for businesses that require sophisticated data analysis capabilities.
- Dependency on Google Services: Although Looker Studio integrates well with Google’s ecosystem, businesses that rely heavily on non-Google platforms may find the need for third-party connectors, which could add to the overall cost and complexity.

